
Independent Proxy Testing: What ProxyStats Measures and How to Use the Data
Published: ≈ 10 min read
Proxy provider websites usually list dozens of specifications: IP pool size, number of supported countries, connection speed, available protocols, and session duration. These parameters can help with an initial evaluation, but they do not always show how a proxy network will perform under real-world conditions.
For example, two providers may offer similar pricing and the same geo-targeting options but differ significantly in response time, request success rate, or sticky session stability. Performance can also change over time due to network load, infrastructure updates, and the condition of the IP pool.
Independent benchmarking services can help evaluate these factors. One of them is ProxyStats, a platform for automated proxy provider testing. The service currently focuses on residential proxies and compares networks using a consistent methodology while regularly updating the results.
Let’s look at what ProxyStats measures, how its rankings are calculated, and, most importantly, how to use this data when choosing proxies.
What Is ProxyStats?
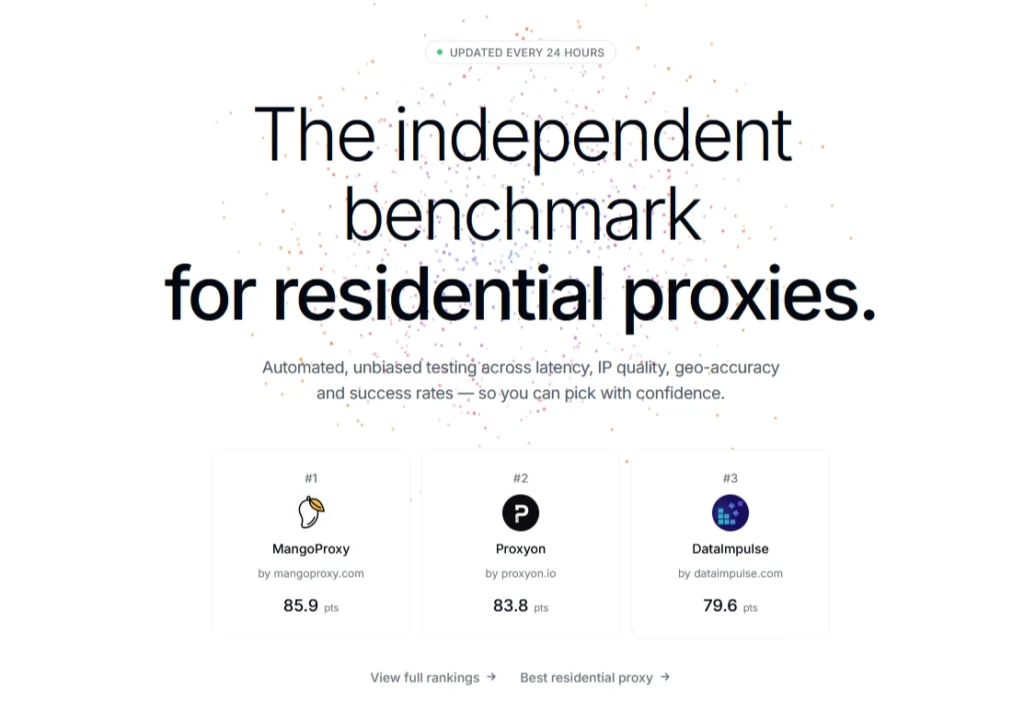
ProxyStats is an independent platform for automated residential proxy testing.
Instead of testing a few IPs once and publishing a static review, the system regularly sends test requests through participating networks and collects the results. Individual tests are then used to build daily metrics, performance history, and overall provider scores.
All participating networks are tested under the same conditions and from the same observation points. ProxyStats currently uses two locations – EU-Central in Frankfurt and US-East in the United States – allowing it to evaluate network performance separately for Europe and the US.
The testing methodology is publicly available. ProxyStats also states that commercial partnerships and affiliate links do not affect rankings: final scores are based on automated test results.
This is an important distinction from many traditional rankings, where it is not always clear why one provider is placed above another.
How ProxyStats Tests Proxies
ProxyStats divides its testing into three levels: Controlled, Neutral, and High-Defense.
This approach helps identify where a problem occurs: within the proxy infrastructure itself, when accessing ordinary external resources, or when connecting to websites with more advanced protection mechanisms.
| Test Type | Where the Test Runs | What It Measures | Frequency |
| Controlled | ProxyStats’ own endpoints | Core network parameters, connection performance, TLS, and session stability | Every 15 minutes |
| Neutral | External neutral resources such as httpbin and Cloudflare Speed Test | Proxy performance outside ProxyStats infrastructure, IP reachability, DNS, TLS, and routing | httpbin – every 30 minutes; Cloudflare Speed Test – every 60 minutes |
| High-Defense | Google and Amazon | Proxy performance on websites with more advanced protection mechanisms | Every 6 hours |
ProxyStats intentionally does not test certain platforms, including LinkedIn, X, Instagram, Booking, and several other services. This is related both to the platforms’ own policies and to the risk of affecting the reputation of tested IPs through excessive automated requests.
For this reason, benchmark results should always be interpreted within the scope of the published methodology rather than treated as a guarantee of identical performance on every website.
What Metrics Does ProxyStats Measure?
The main value of a benchmark is not simply a provider’s final ranking, but the individual metrics behind it.
Success Rate
Success Rate shows what percentage of requests returned a usable result.
ProxyStats does not treat every HTTP 200 response as successful. If a website returns a CAPTCHA, challenge page, or another blocking screen instead of the expected content, the request is considered unsuccessful.
This makes the metric more informative than simply counting HTTP responses.
However, Success Rate alone is not enough for a complete provider comparison. On protected targets, strong residential networks may produce relatively similar results, so latency, session stability, and IP pool quality should also be considered.
Median Latency and P95 (P50/P95 Latency)
Latency measures how long it takes to receive a response through a proxy.
P50, or median latency, is the value below which half of all requests are completed. It provides a good indication of typical response time.
However, the median does not reflect occasional slow requests. This is why ProxyStats also uses P95 – the latency value within which 95% of requests are completed.
For example, two networks may have almost identical median latency while showing very different P95 results. In this case, even though their typical speeds are similar, one network may produce slow responses much more frequently.
ProxyStats also evaluates Latency Consistency, which shows how much slower response times differ from typical latency.
The smaller the variation, the more consistent the network performance.
Session Reliability
Not every use case requires a new IP for every request.
During authentication, multi-step navigation, form completion, and other stateful workflows, it is often important for the same IP address to remain active throughout the session.
For this reason, ProxyStats separately measures Session Reliability – the ability of a sticky session to retain the same exit IP.
During the test, the system sends a sequence of requests and checks whether the IP changes unexpectedly. ProxyStats also measures the Unexpected Rotation Rate: the more frequently an IP changes before the expected session ends, the greater the risk of disrupting the workflow.
In the published ProxyStats methodology, this test currently uses a short testing window, so longer sessions are not yet included in the core test.
Clean IP Rate
Clean IP Rate shows the percentage of tested addresses that remain below ProxyStats’ threshold for suspicious activity according to AbuseIPDB.
This metric helps assess the reputation of an IP pool and the potential risk of additional checks or restrictions from websites.
Clean IP Rate currently does not affect the overall ProxyStats score. The service tracks this metric separately while it builds a longer history of measurements.
Rotation Depth
A provider’s advertised IP pool size is difficult to verify directly. ProxyStats therefore uses a more practical metric called Rotation Depth.
The system performs a fixed number of requests and measures how many unique exit IPs and subnets appear in the sample.
It is important to understand that this metric does not represent the provider’s full IP pool size. Instead, it shows the diversity of addresses observed under the same testing volume.
For high-volume workloads, this can be a useful indicator: frequent reuse of the same IPs may reduce the effectiveness of rotation.
Geo Integrity
ProxyStats also measures Geo Integrity.
This metric checks whether the actual country of the exit IP matches the requested country. ProxyStats currently performs this test for controlled US and Germany exits.
For use cases where a specific location matters, this can be just as important as connection speed: a fast IP is of limited value if its geolocation is detected incorrectly.
Geo Integrity is currently measured separately and does not affect the provider’s overall score.
What Does the Composite Score Mean?
To make provider comparisons easier, ProxyStats calculates a Composite Score from 0 to 100. It combines several key indicators to provide a quick overview of a network’s overall performance.
Under the current methodology, the score is based on four main areas:
- Core Network Performance – 35%;
- Session Reliability – 30%;
- Neutral Reachability – 15%;
- Target Reachability – 20%.
ProxyStats also measures Geo Integrity and Clean IP Rate, but these metrics currently do not affect the Composite Score.
The calculation uses data from a rolling 30-day window. This helps smooth out short-term fluctuations and evaluates network performance over time rather than relying on a single particularly good or bad test.
The Composite Score should not be treated as a universal measure of proxy quality. Different characteristics matter for different workloads: one use case may depend more heavily on session stability, while another may prioritize speed or target reachability.
For this reason, the overall score is best considered together with the individual metrics.
How to Use ProxyStats Data in Practice
Imagine that two providers have Composite Scores of 80 and 78.
It may be tempting to assume that the provider with 80 is automatically the better choice. However, depending on the specific use case, the second provider may actually be more suitable.
| Use Case | What to Look At in ProxyStats |
| Large volumes of independent requests | Success Rate, median latency and P95, Rotation Depth, Clean IP Rate |
| Authentication and work within a single session | Session Reliability, Unexpected Rotation Rate, connection consistency, P95 latency |
| Work with specific types of resources | The relevant use-case ranking and the metrics given more weight in that scenario |
| Choosing between providers with similar Composite Scores | Individual metrics and their historical performance rather than the final score alone |
ProxyStats also provides separate rankings for Google SERP, Amazon & E-commerce, Social Media & B2B, Travel, Real Estate, and Web Crawling. The weight of individual metrics in the final score may vary depending on the use case.
Why Performance History Matters
Proxy network performance can change over time.
Network load, routing, infrastructure updates, IP pool conditions, and other factors can all affect results. A test performed several months ago may therefore no longer reflect the network’s current state.
ProxyStats bases its scores on regular testing, while provider pages make it possible to track current values and historical performance.
This allows users to look beyond a single number and examine trends, including temporary drops, recoveries, and changes following infrastructure updates.
This provides more context than a one-time test or a screenshot of a provider’s current ranking. When choosing proxies, it is more useful to understand how consistently a network performs over time.
Can an Independent Benchmark Replace Your Own Testing?
No. Independent testing can help narrow down the options and reveal the strengths and weaknesses of different networks under the same conditions. However, actual results for a specific user will still depend on:
- the target website;
- selected GEO;
- request type;
- session duration;
- traffic volume;
- request frequency;
- rotation settings;
- project requirements for speed and stability.
Every methodology also has limitations. ProxyStats publishes these alongside its testing methodology, including the session testing window, current GEO coverage, and the list of resources the platform intentionally does not test.
The best approach is therefore to use an independent benchmark for an initial comparison, shortlist several suitable providers, and then test them within your own real-world workflow.
Conclusion
ProxyStats demonstrates why proxy providers should not be compared solely by price, advertised IP pool size, or a single Success Rate figure.
The platform measures different aspects of residential network performance, including request success rate, latency, session stability, external resource reachability, performance on protected targets, IP reputation, and IP diversity.
These metrics are combined into an overall score, while the individual results remain available for deeper analysis.
For users, this makes it possible to compare providers based on the factors that matter for their specific use case rather than choosing a service solely because of its position in an overall ranking.
That is the main value of independent benchmarks: they do not make the decision for the user, but provide more data for making an informed choice.
Frequently asked questions
Here we answered the most frequently asked questions.
What Is ProxyStats?
ProxyStats is an independent platform for automated residential proxy testing. The service regularly tests participating networks using a consistent methodology and provides individual metrics, performance history, and overall provider scores.
What Metrics Does ProxyStats Measure?
Key metrics include Success Rate, latency, Session Reliability, Unexpected Rotation Rate, Rotation Depth, Geo Integrity, and Clean IP Rate. Some of these metrics are used to calculate the overall Composite Score.
Can I Choose a Proxy Provider Based Only on the Composite Score?
No. The Composite Score provides a quick way to compare overall provider performance, but the importance of individual metrics varies depending on the use case.
For example, Session Reliability is particularly important for longer sessions, while speed, Success Rate, and Rotation Depth may matter more for large volumes of independent requests.
Does ProxyStats Replace Your Own Proxy Testing?
No. An independent benchmark can help narrow down the options and compare providers under the same conditions, but actual performance depends on the target website, GEO, session duration, request frequency, and other project-specific factors. After reviewing benchmark data, it is still best to test the selected provider in your own workflow.