Traceroute Results Explained: How to Read Each Hop

What Traceroute Results Show
When you run traceroute, you get a list of intermediate nodes between your system and the destination server. Each line represents one step in the path, often called a “hop”.
At first glance, the output may look technical, but in practice it answers a simple question:
Where exactly does your connection slow down or break?
Each hop reflects a router or network gateway that processes your request on its way to the destination.
Quick Example of Traceroute Output
A typical result may look like this:
- 1 192.168.1.1 1 ms 1 ms 1 ms
- 2 10.10.0.1 5 ms 6 ms 5 ms
- 3 172.16.12.1 10 ms 11 ms 10 ms
- 4 203.0.113.5 40 ms 42 ms 41 ms
- 5 example.com 45 ms 47 ms 46 ms
Each row contains several important pieces of information:
- hop number
- IP address or hostname
- response times
Understanding these elements is key to reading traceroute correctly.
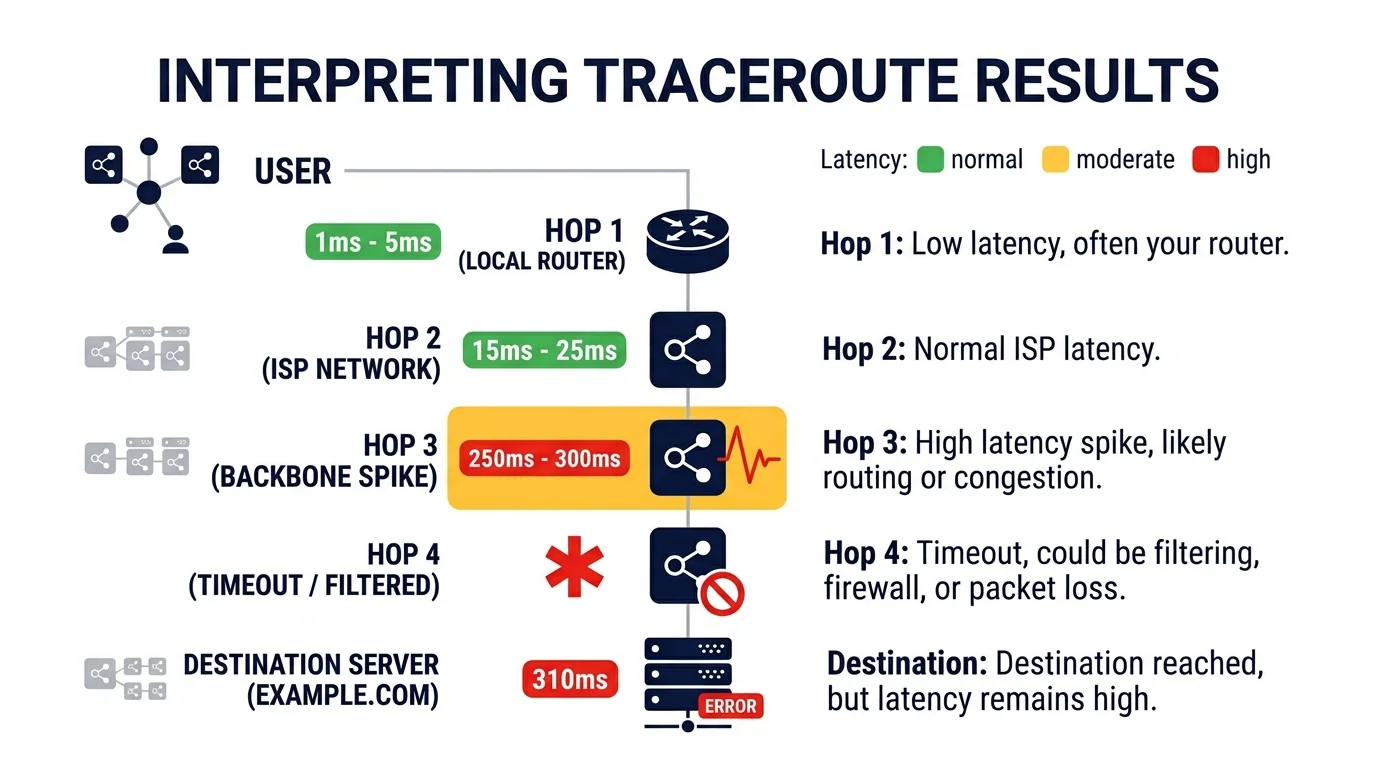
What Each Hop Means
Hop Number
The number on the left shows the position of the node in the route.
- hop 1 – usually your local router
- early hops – your ISP network
- middle hops – regional or backbone networks
- final hop – destination server
The higher the hop count, the farther the request has traveled.
IP Address or Hostname
This indicates which device responded to the traceroute request.
Sometimes you will see:
- private IP addresses (internal networks)
- public IP addresses (internet routers)
- domain names (if reverse DNS is available)
This helps identify which networks your traffic passes through.
Response Time (Latency)
Each hop usually shows three response times in milliseconds.
These represent how long it took for packets to reach that node and return.
Example:
- 40 ms 42 ms 41 ms
These values are not always identical because of network conditions and routing variability.outer is configured to drop ICMP probes for security, even though it’s successfully forwarding your main traffic.accessible from outside the system.
How to Identify Network Issues
Traceroute becomes powerful when you know what to look for.
Sudden Latency Increase
If response time suddenly jumps between two hops, that location may be a bottleneck.
Example:
| Hop | Latency |
| 3 | 10 ms |
| 4 | 120 ms |
This usually indicates:
- routing inefficiency
- overloaded network node
- geographic distance
If latency remains high after that hop, the issue is likely real.
Consistent High Latency
If all hops show high response time, the delay is likely caused by:
- long physical distance
- slow network connection
- routing across multiple regions
For deeper understanding, see Proxy Latency Explained.
Packet Loss or Missing Responses
If a hop shows no response, it may appear like:
* * *
This can indicate:
- packet filtering
- firewall rules
- router ignoring traceroute packets
Important: this does not always mean a failure.
Why Some Hops Do Not Respond
Modern networks often restrict ICMP responses used by traceroute.
Common reasons:
- security policies
- firewall filtering
- rate limiting on routers
As a result, some nodes intentionally do not reply.
This is normal behavior in many infrastructures.
When a Timeout Is a Real Problem
Timeouts become important when they appear at the end of the trace.
If the final hops do not respond, it may indicate:
- destination server is unreachable
- network path is broken
- service is down
This is different from isolated timeouts in the middle of the route.
Traceroute and Real Infrastructure Debugging
In practice, engineers rarely look at traceroute as a simple list of hops. Instead, they use it as a diagnostic tool to understand network behavior.
Typical real-world scenarios:
• a website loads slowly in one region
• API requests fail intermittently
• users report connection issues
• latency spikes during peak traffic
Running traceroute helps identify whether the issue is:
- local network
- ISP routing
- backbone provider
- destination server
You can run a live check using MangoProxy IP Trace Tool.
Traceroute vs Real Network Performance
One important detail: traceroute does not always reflect actual application performance.
Why:
- routers may deprioritize traceroute packets
- ICMP traffic is handled differently than real data
- some nodes respond slower than they forward traffic
This means:
👉 a slow hop does not always mean real traffic is slow
👉 consistent patterns matter more than isolated spikes
Combining Traceroute with Other Tools
Traceroute works best when combined with other diagnostics.
For example:
• My IP – shows how your connection is seen externally
• IP Lookup – helps identify networks and ASN ownership
• Proxy Checker – verifies proxy connectivity
Together, these tools provide a more complete picture of network behavior.
Glossary
- Hop
A single step between two network devices in a route. - Latency
The time it takes for data to travel between two points. - Packet
A unit of data transmitted across a network. - Timeout
A situation where a response is not received within expected time.

Frequently asked questions
Here we answered the most frequently asked questions.
What does each hop in traceroute mean?
Each hop represents a network device that processes your request on its way to the destination.
Why do some hops show high latency?
This may be caused by routing distance, congestion, or how routers prioritize traceroute traffic.
Is traceroute accurate?
Traceroute provides a useful approximation of network paths, but some nodes may not respond or may behave differently from real traffic.
What does * * * mean in traceroute?
This means that the node did not send a response. This may be caused by ICMP filtering, firewall rules, or the node ignoring diagnostic requests.
I used to assume every latency spike in a traceroute meant there was a network issue. Turns out there’s a lot more context to interpreting the output correctly.