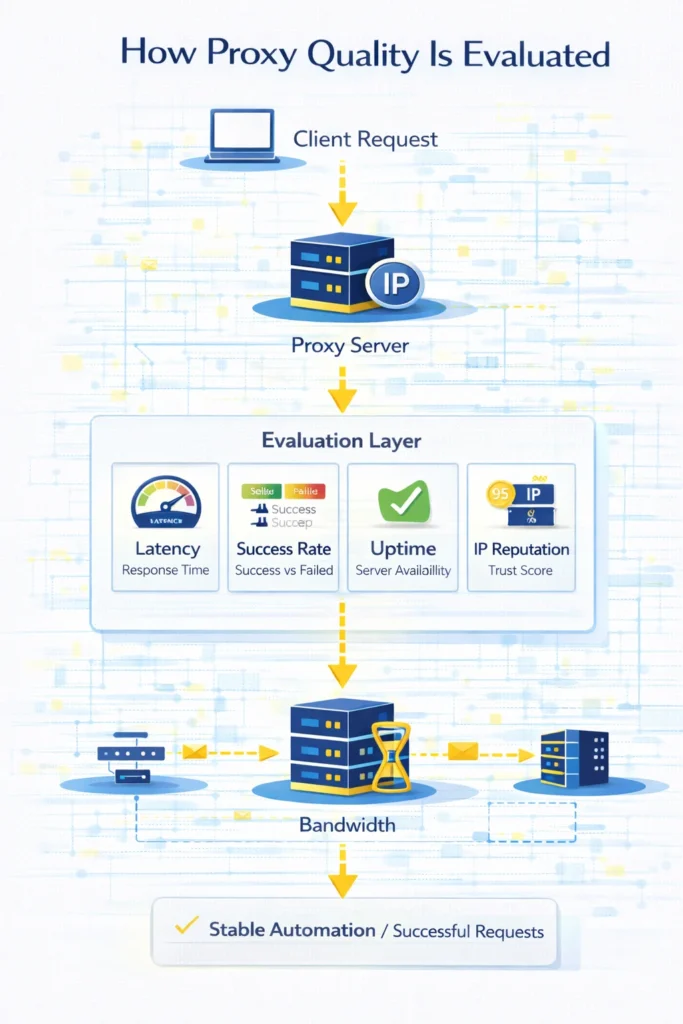
Which Metrics Matter When Evaluating Proxy Quality

Choosing infrastructure only by price or geographic location often leads to unstable connections and unpredictable results. In practice, the real performance of a proxy network is defined by several measurable indicators that show how reliably requests are processed.
These indicators help developers understand whether a network can handle automation tasks, scraping workloads, or monitoring systems without frequent errors.
When these metrics are monitored correctly, it becomes much easier to identify unstable nodes, overloaded IP pools, or routing problems before they disrupt production systems.
Understanding what actually defines proxy quality helps engineers select better infrastructure and maintain stable request pipelines.
Key Metrics That Define Proxy Performance
Several technical indicators determine whether a proxy network performs well under real-world traffic.
The most commonly used evaluation metrics include:
- latency
- success rate
- uptime
- connection stability
- anonymity level
- IP reputation
- bandwidth capacity
Each of these indicators reflects a different aspect of network behavior. Looking at them together provides a much clearer picture of how reliable the infrastructure really is.
Latency and Response Time
Latency measures how long it takes for a request to travel through the network and return a response.
In a proxy environment this path usually includes:
client → proxy server → target website → proxy → client
Even small delays across each step accumulate quickly when thousands of requests are processed.
High latency typically results in:
- slower scraping pipelines
- delayed automation workflows
- increased timeout probability
In large-scale systems even a few hundred milliseconds of additional delay can significantly reduce total request throughput.
If you want to understand this concept in more detail, see Proxy Latency Explained.
Request Success Rate
Success rate shows how many requests are completed successfully compared to the total number of attempts.
This metric is particularly important for systems that send thousands of automated requests.
Typical benchmarks look like this:
| Network Quality | Success Rate |
| Excellent | 98-99% |
| Stable | 95-97% |
| Average | 90-94% |
| Problematic | below 90% |
Lower success rates usually indicate problems such as blocked IPs, unstable routing, or overloaded proxy nodes.
Infrastructure Uptime
Uptime measures how consistently servers remain available over time.
Reliable infrastructure typically maintains availability above 99%, which ensures that automation tasks can run without interruptions.
When uptime drops, systems may experience:
- connection failures
- retry loops
- interrupted scraping sessions
Monitoring uptime helps identify unstable servers before they start affecting production workloads.
Connection Stability
Some proxies work well for individual requests but become unreliable during sustained traffic.
Connection stability reflects how consistently the network maintains active sessions when handling large request batches.
Instability may appear as:
- dropped connections
- inconsistent response timing
- random request failures
Testing proxy endpoints before deploying them into automation environments helps detect unstable nodes early.
You can quickly test connectivity using Proxy Checker.
IP Reputation
Another factor that strongly affects reliability is the reputation of the IP address itself.
Websites often evaluate incoming traffic and may restrict access from addresses that previously generated suspicious activity.
Poor IP reputation can lead to:
- CAPTCHA challenges
- request throttling
- temporary blocks
Maintaining clean IP pools significantly improves long-term request success rates.
Bandwidth and Throughput
Bandwidth defines how much data can pass through the network within a given time frame.
Higher bandwidth allows systems to process larger datasets and transfer more information per request.
However, bandwidth alone does not guarantee high performance. Routing quality and infrastructure stability also influence overall speed.
Quick Overview of Proxy Performance Metrics
The table below summarizes the most important indicators used to evaluate proxy infrastructure.
| Metric | What It Indicates | Why It Matters |
| Latency | Request response delay | affects scraping speed |
| Success Rate | Completed requests | determines reliability |
| Uptime | Server availability | ensures continuous operation |
| Stability | Session consistency | prevents dropped connections |
| IP Reputation | Address trust score | reduces blocking risk |
| Bandwidth | Data transfer capacity | supports heavy workloads |
Evaluating infrastructure using several metrics together gives a more accurate picture than relying on a single indicator.
How Developers Measure Proxy Performance
Before integrating proxies into automation workflows, engineers typically run several tests to verify reliability.
The typical evaluation process includes:
- verifying proxy connectivity
- measuring latency and response time
- checking IP location accuracy
- evaluating request success rate
- testing anonymity level
Developers often combine multiple tools to analyze these characteristics.
Useful diagnostic tools include:
- Proxy Checker for testing connectivity
- My IP for verifying external address
- IP Lookup for analyzing network ownership and metadata
Using these tools helps identify slow or unreliable endpoints before they affect production systems.
When Proxy Quality Becomes Critical
Performance metrics become especially important in systems that handle large request volumes.
Examples include:
- web scraping platforms
- automation frameworks
- SEO monitoring tools
- ad verification systems
- market intelligence platforms
In these environments even small instability can significantly reduce overall system efficiency.
Glossary
Latency
Time required for a request to travel between client, proxy server and destination website.
Success rate
Percentage of requests that successfully receive valid responses.
Uptime
Measure of how consistently servers remain available without interruptions.
IP reputation
Indicator showing how trustworthy an IP address appears to external websites.
Anonymity level
Degree to which the original user identity is hidden when traffic passes through a proxy.

Frequently asked questions
Here we answered the most frequently asked questions.
What is the most important proxy metric?
Latency and success rate are usually the most important indicators because they directly influence automation speed and request reliability.
What success rate should a good proxy network have?
High-quality infrastructure typically maintains success rates above 95%, with premium networks reaching 98-99%.
Can low latency guarantee better proxy performance?
Not necessarily. While response speed is important, uptime, stability and IP reputation also affect overall reliability.
How can proxy performance be tested?
Proxy performance can be evaluated by measuring latency, verifying connection stability, and analyzing IP reputation before deploying proxies into production systems.